A Java thread dump is a way of finding out what every thread in the JVM is doing at a particular point in time. This is especially useful if your Java application sometimes seems to hang when running under load, as an analysis of the dump will show where the threads are stuck.
You can generate a thread dump under Unix/Linux by running kill -QUIT <pid>, and under Windows by hitting Ctl + Break.
A great example of where this would be useful is the well-known Dining Philosophers deadlocking problem. Taking example code from Concurrency: State Models & Java Programs, we can cause a deadlock situation and then create a thread dump.
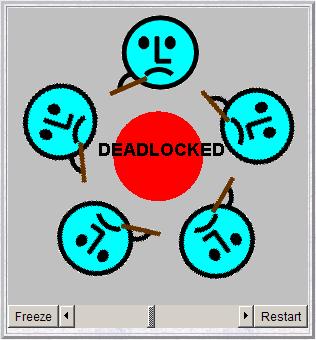
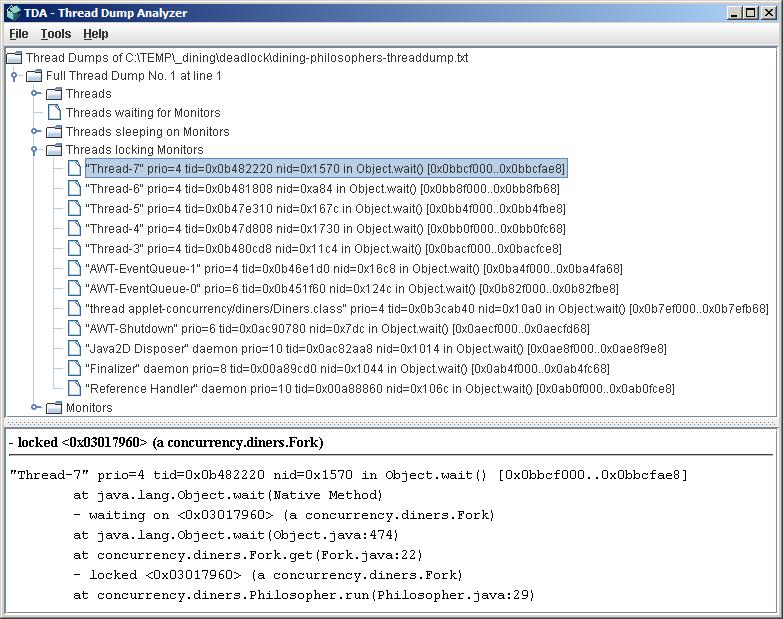
In the example below (shown using tda), we can see that the 5 Philosopher threads each have a lock on a Fork object and are each waiting to obtain a lock on a second Fork object before they can eat. Unfortunately this never happens and all the philosophers starve.
Download the thread dump from here (7 KB).
Note that not all hangs are going to be due to deadlocks, and there are many tools (including Eclipse) that will help you analyse thread dumps.
Related Posts


7 Comments
Comments are closed.
The Sun 1.5 JVM is able to detect some simple deadlocks.
Using the example code from
http://java.sun.com/docs/books/faq/src/thr/DeadlockExample.html the thread dump includes the following information:
Found one Java-level deadlock:
=============================
“Thread-1”:
waiting to lock monitor 0x00a891ec (object 0x06c216e0, a java.lang.String),
which is held by “Thread-0”
“Thread-0”:
waiting to lock monitor 0x00a8920c (object 0x06c21708, a java.lang.String),
which is held by “Thread-1”
Some additional points:
· You may be able to generate a thread dump from the Admin Console of your application server. Under Unix, this is much simpler than doing a kill -3 from the shell, and it means that you do not have to be a member of the same group that the application server is a member of.
· It is helpful to run multiple stack traces over a short period of time. If the same thread is still stuck at the same position of code, that is a good indication of a problem. This is a good thing to create a shell script for.
· I quite liked this blog entry on stack traces and thread dumps: http://www.me.umn.edu/~shivane/blogs/cafefeed/2004/06/of-thread-dumps-and-stack-traces.html
· Also, this one: http://java.sun.com/developer/technicalArticles/Programming/Stacktrace/
Good to see you back posting
🙂
Any idea where the thread dump is located, when taking one using the ctrl + \, because I could not find a thread dump when I simulated a deadlock on my WinXP computer?
Here is example of how to generate thread dump in a Java program http://www.deepakgaikwad.net/index.php/2012/01/10/programmatic-thread-dump-generation-using-jmx-apis.html
Hi Stuart and good job with your performance related Blog here,
Glad to see other individuals interested in sharing knowledge about Java Thread Dump. This is very important skill to master, especially for individuals involved in Java EE production support.
I’m creating right now a whole article series from my Blog on this subject, your readers may be interested in this. It includes also real case studies and analysis approaches.
http://javaeesupportpatterns.blogspot.com/2011/11/how-to-analyze-thread-dump-part-1.html
Thanks.
P-H
http://fastthread.io/ is a good analytical tool with all types of graphical representation on thread dumps. I will recommend this tool to all my java team members.