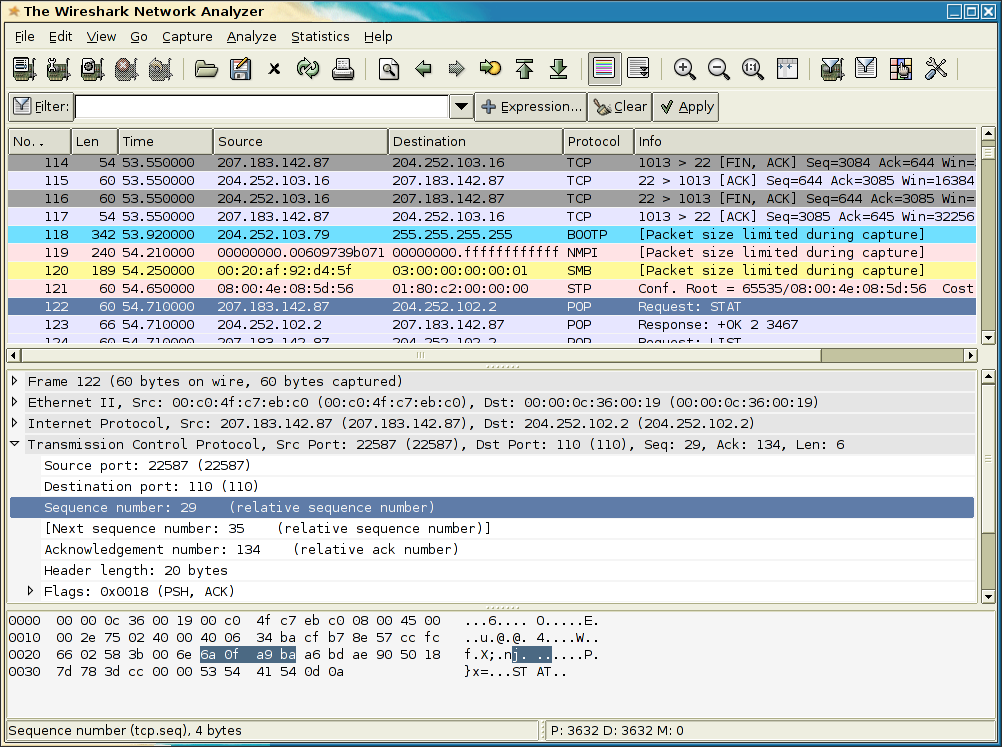
Yet another application to add to your performance testing toolkit is Wireshark (previously called Ethereal). A packet sniffer like Wireshark will let you see your network traffic at all the different protocol layers.
A naturally curious person might use it to investigate why the lights on their router started flashing all the time just after they installed that really useful piece of software that let them change their mouse cursor.
As a performance tester, I use it when I’m trying to figure out what the application I am trying to record with LoadRunner is sending and receiving, and the VuGen log doesn’t contain enough information (and I can’t get it by recording in Winsock mode). 99% of the time this isn’t necessary but occasionally, when the application uses some sort of weird (or custom) protocol, it helps to show what is going on.
Recently I was running a LoadRunner training session and was asked to take a look at the application the company was developing. It was a web-based application that had an embedded ActiveX object that also communicated with the server. Recording just HTTP did not record any traffic to or from the object. Recording with the Web/Winsocket Dual Protocol vuser type recorded a message from the object to the server (as well as all the HTTP traffic from the web page), but no communication from the server to the object; nothing appeared in the recording log either.
To double check that the object really was getting information from the server, rather than values being passed from the HTML, a network trace was run. This showed that there really was a message being sent to the ActiveX object, and that for some reason VuGen was not recording it correctly. In this situation, it is easy to give Mercury Support your script and your tracefile and they will pass it on to the R&D team who will usually give you a work-around or write you a patch in a couple of days.
So, anyway, sometimes you will come across an application that talks to the server in some kind of unconventional way; and sometimes a packet sniffer helps you figure out what is going on. Wireshark is your best option because it is free and it has a comparable feature-level with expensive proprietary tools like Sniffer Pro.
Download it from the Wireshark website.
Some other tools that I have talked about previously:
- Free WAN emulator (Dummynet on FreeBSD)
- Unix utilities on Windows
- WebScarab (a security test tool for web applications)
- FreeQueryBuilder (a better SQL tool; now called SQLeonado)
- LogParser (a website log analyser)
Related Posts


3 Comments
Comments are closed.
Thanks for the heads-up on this one. I can definitely use this when diagnosing traffic and performance problems.
Chris
http://amateureconblog.blogspot.com/
You should probably note that in many companies, running Ethereal/Wireshark and similiar utilities, especially in promiscuous mode, is grounds for termination.
Network admins get very, very nervous when an Ethernet connection goes into promiscuous mode on their network, it is very detectable.
Make sure you understand your company’s policies on this sort of thing before you crank up any kind of non-proxy packet sniffers. Having a good relationship with the network admins helps too. For instance, I made arrangements once that there would be only two hosts *ever* running Ethereal or similar tools, and if the network admin were ever to detect a different host in promiscuous mode, I would help investigate the situation.
Thanks for the information. I was also facing similar kind of problem sometime back. Our application was using an ActiveX object which communicated with the server using windows sockets. We were not given details about this socket level communication which in turn resulted in pure HTTP functions alone getting generated. We were completely unaware of this. But Ethereal helped us to find out that the application is using Sockets along with standard HTTP communication. It helps especially you have something not communicated to you by the development team :-))